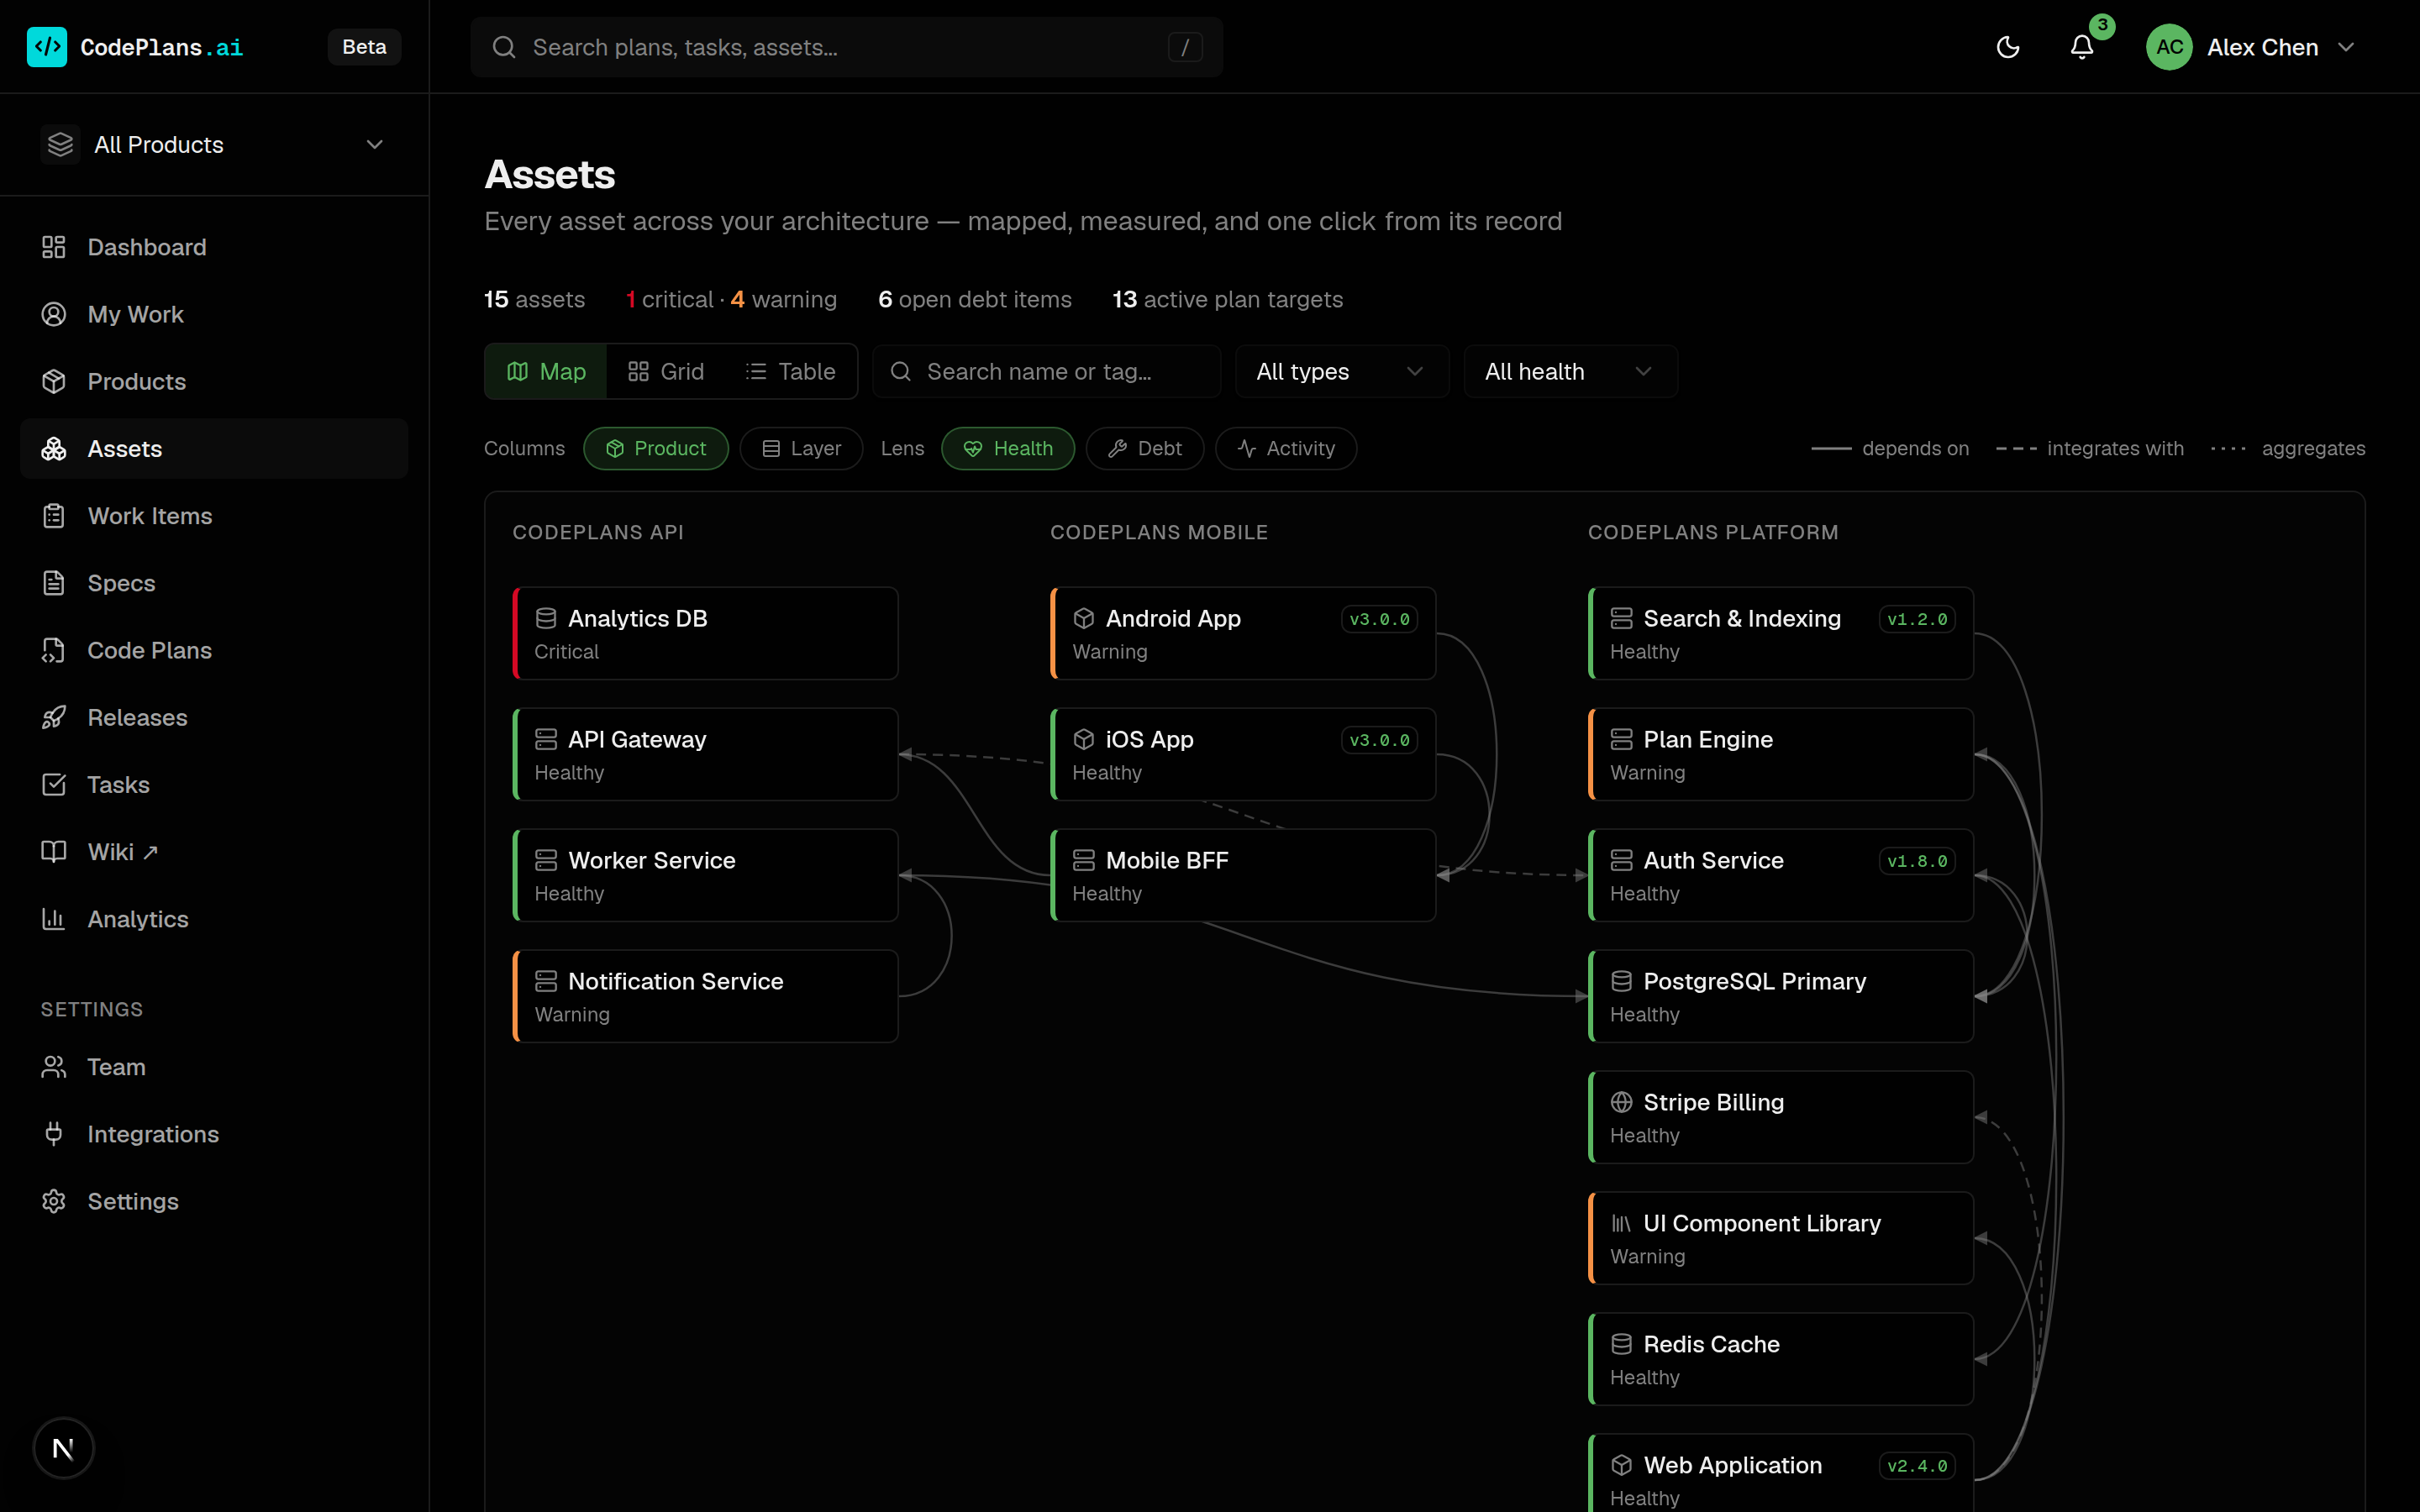
A system map drawn from your inventory
Products become columns, and assets are placed by layer with dependency edges between them. Lenses recolor the map by health, debt or delivery activity. Hover an asset to see its blast radius. Grid and table views sit beside it.
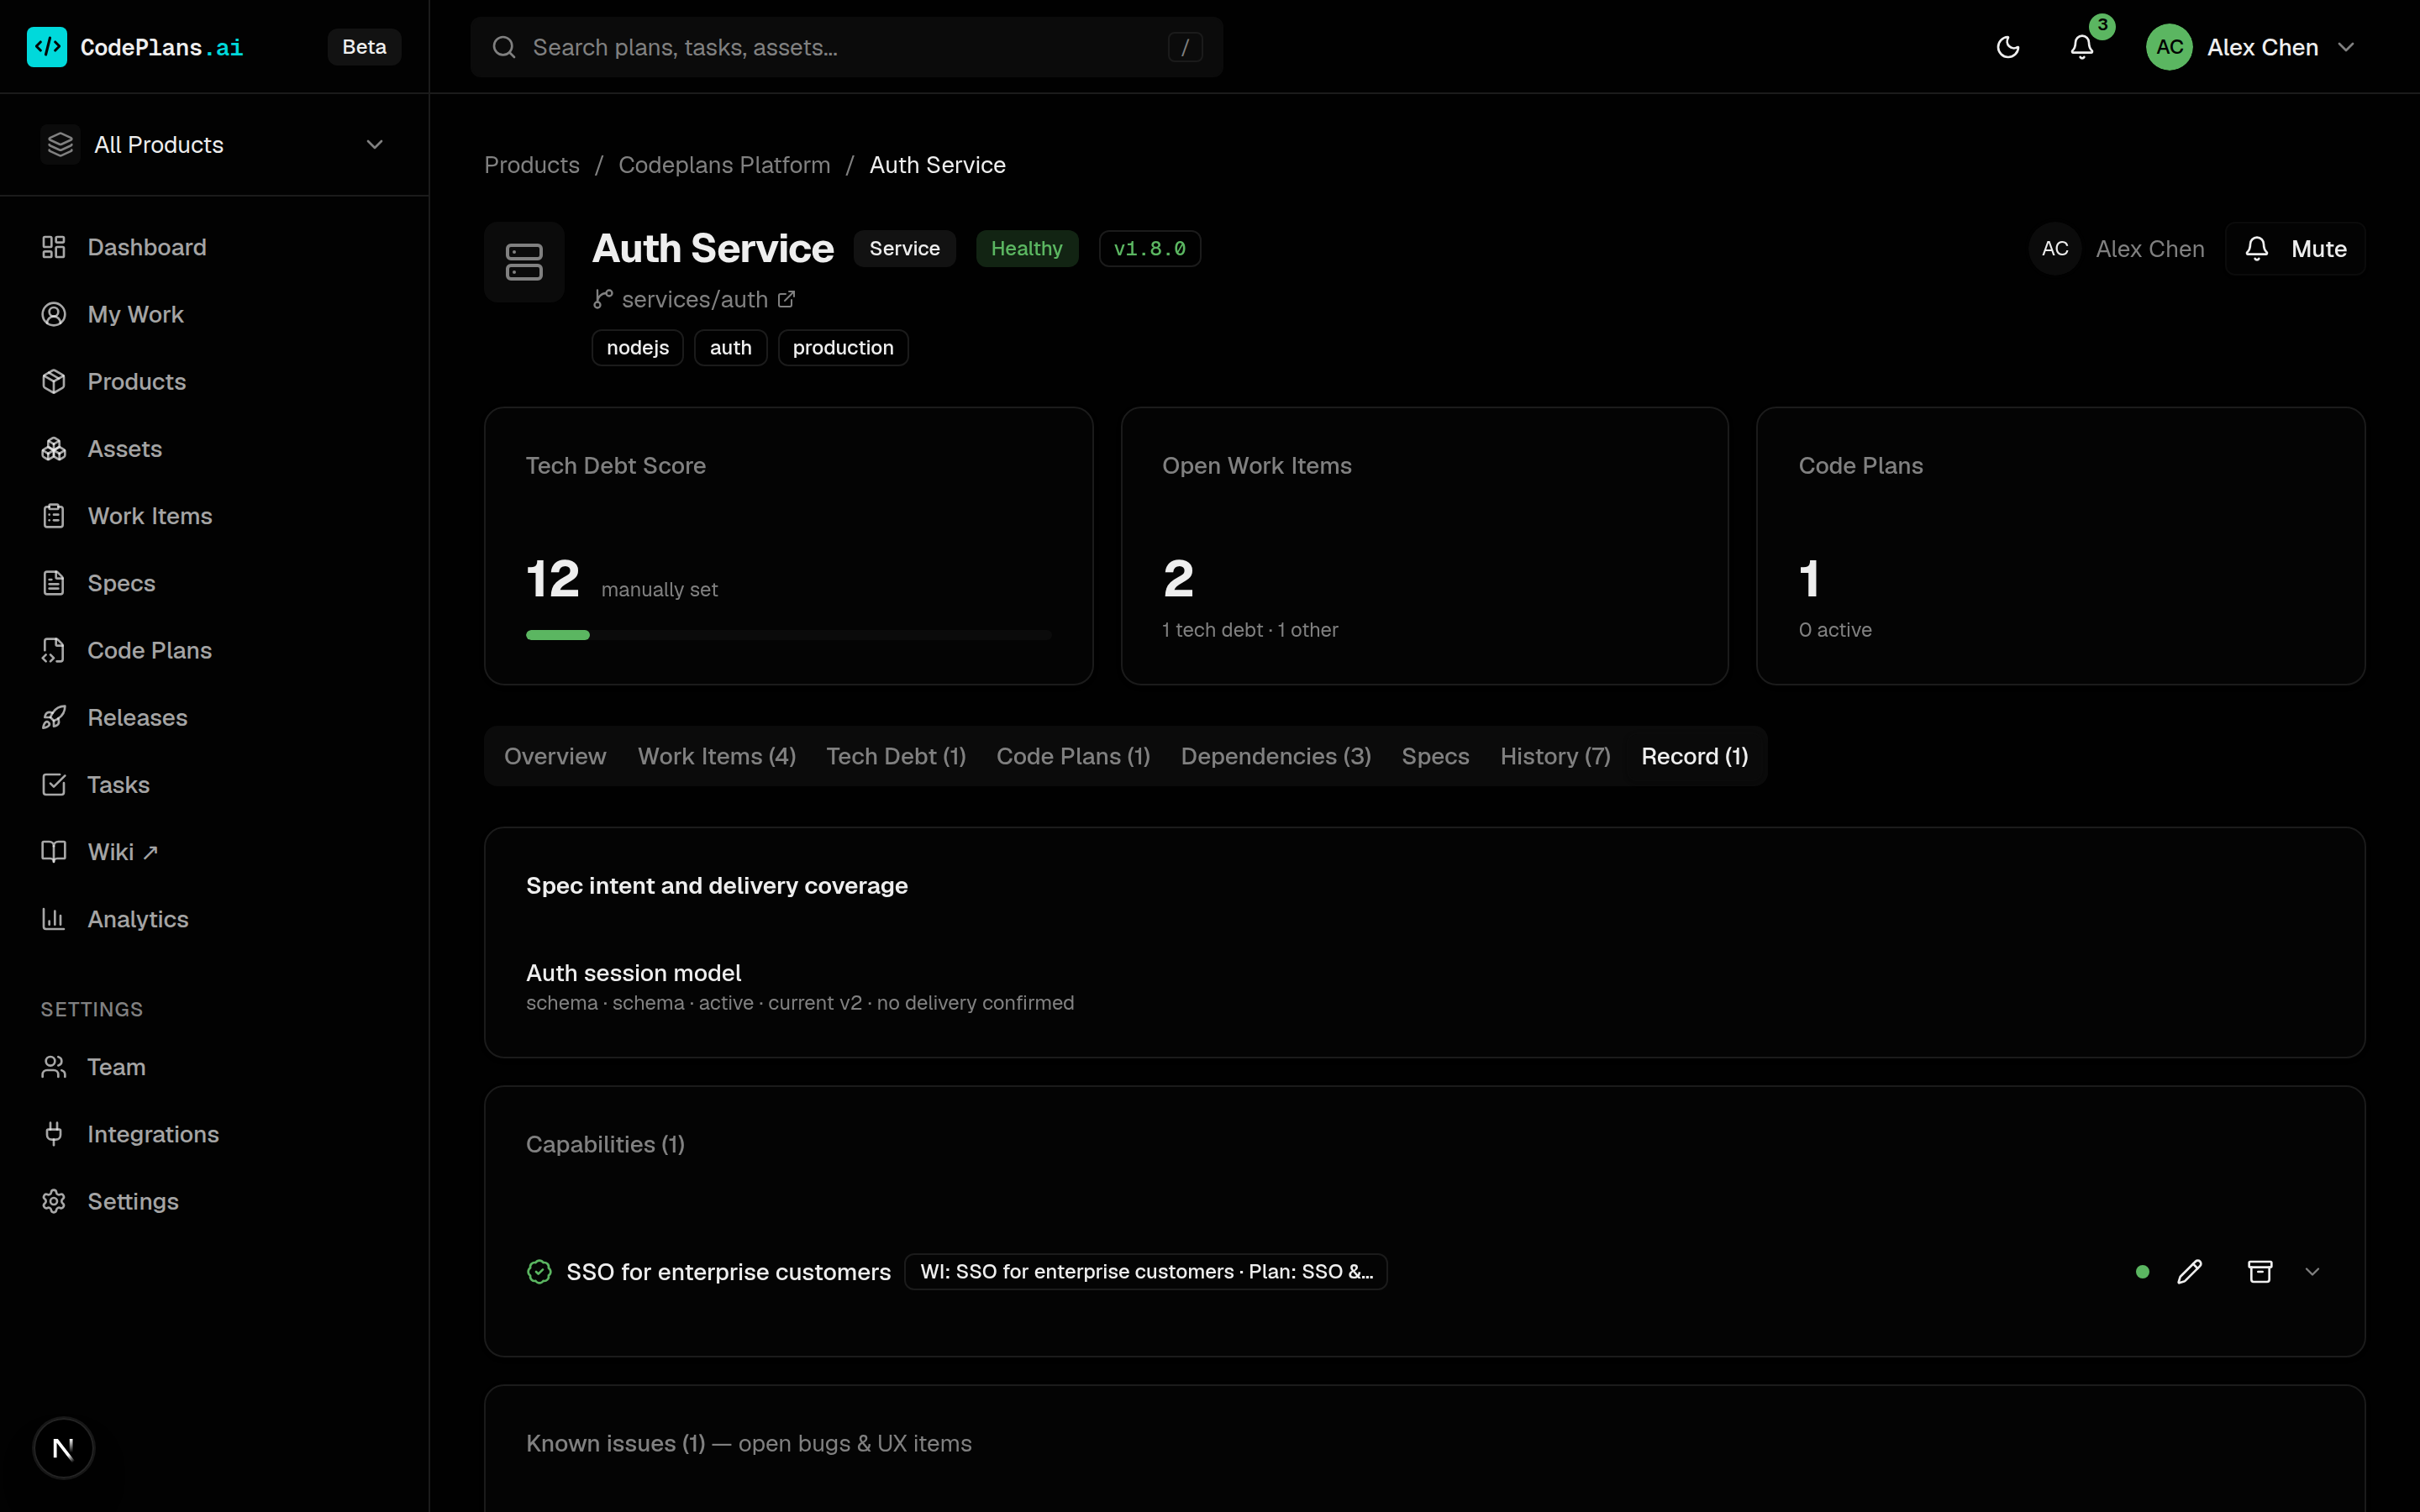
What an asset actually does, with evidence
The Record tab is a capabilities register built from delivered work. Each claim carries its work item, plan, release and the spec version it implemented. Active specs show current intent next to the latest version confirmed by delivery. Known issues and debt are derived from open work.
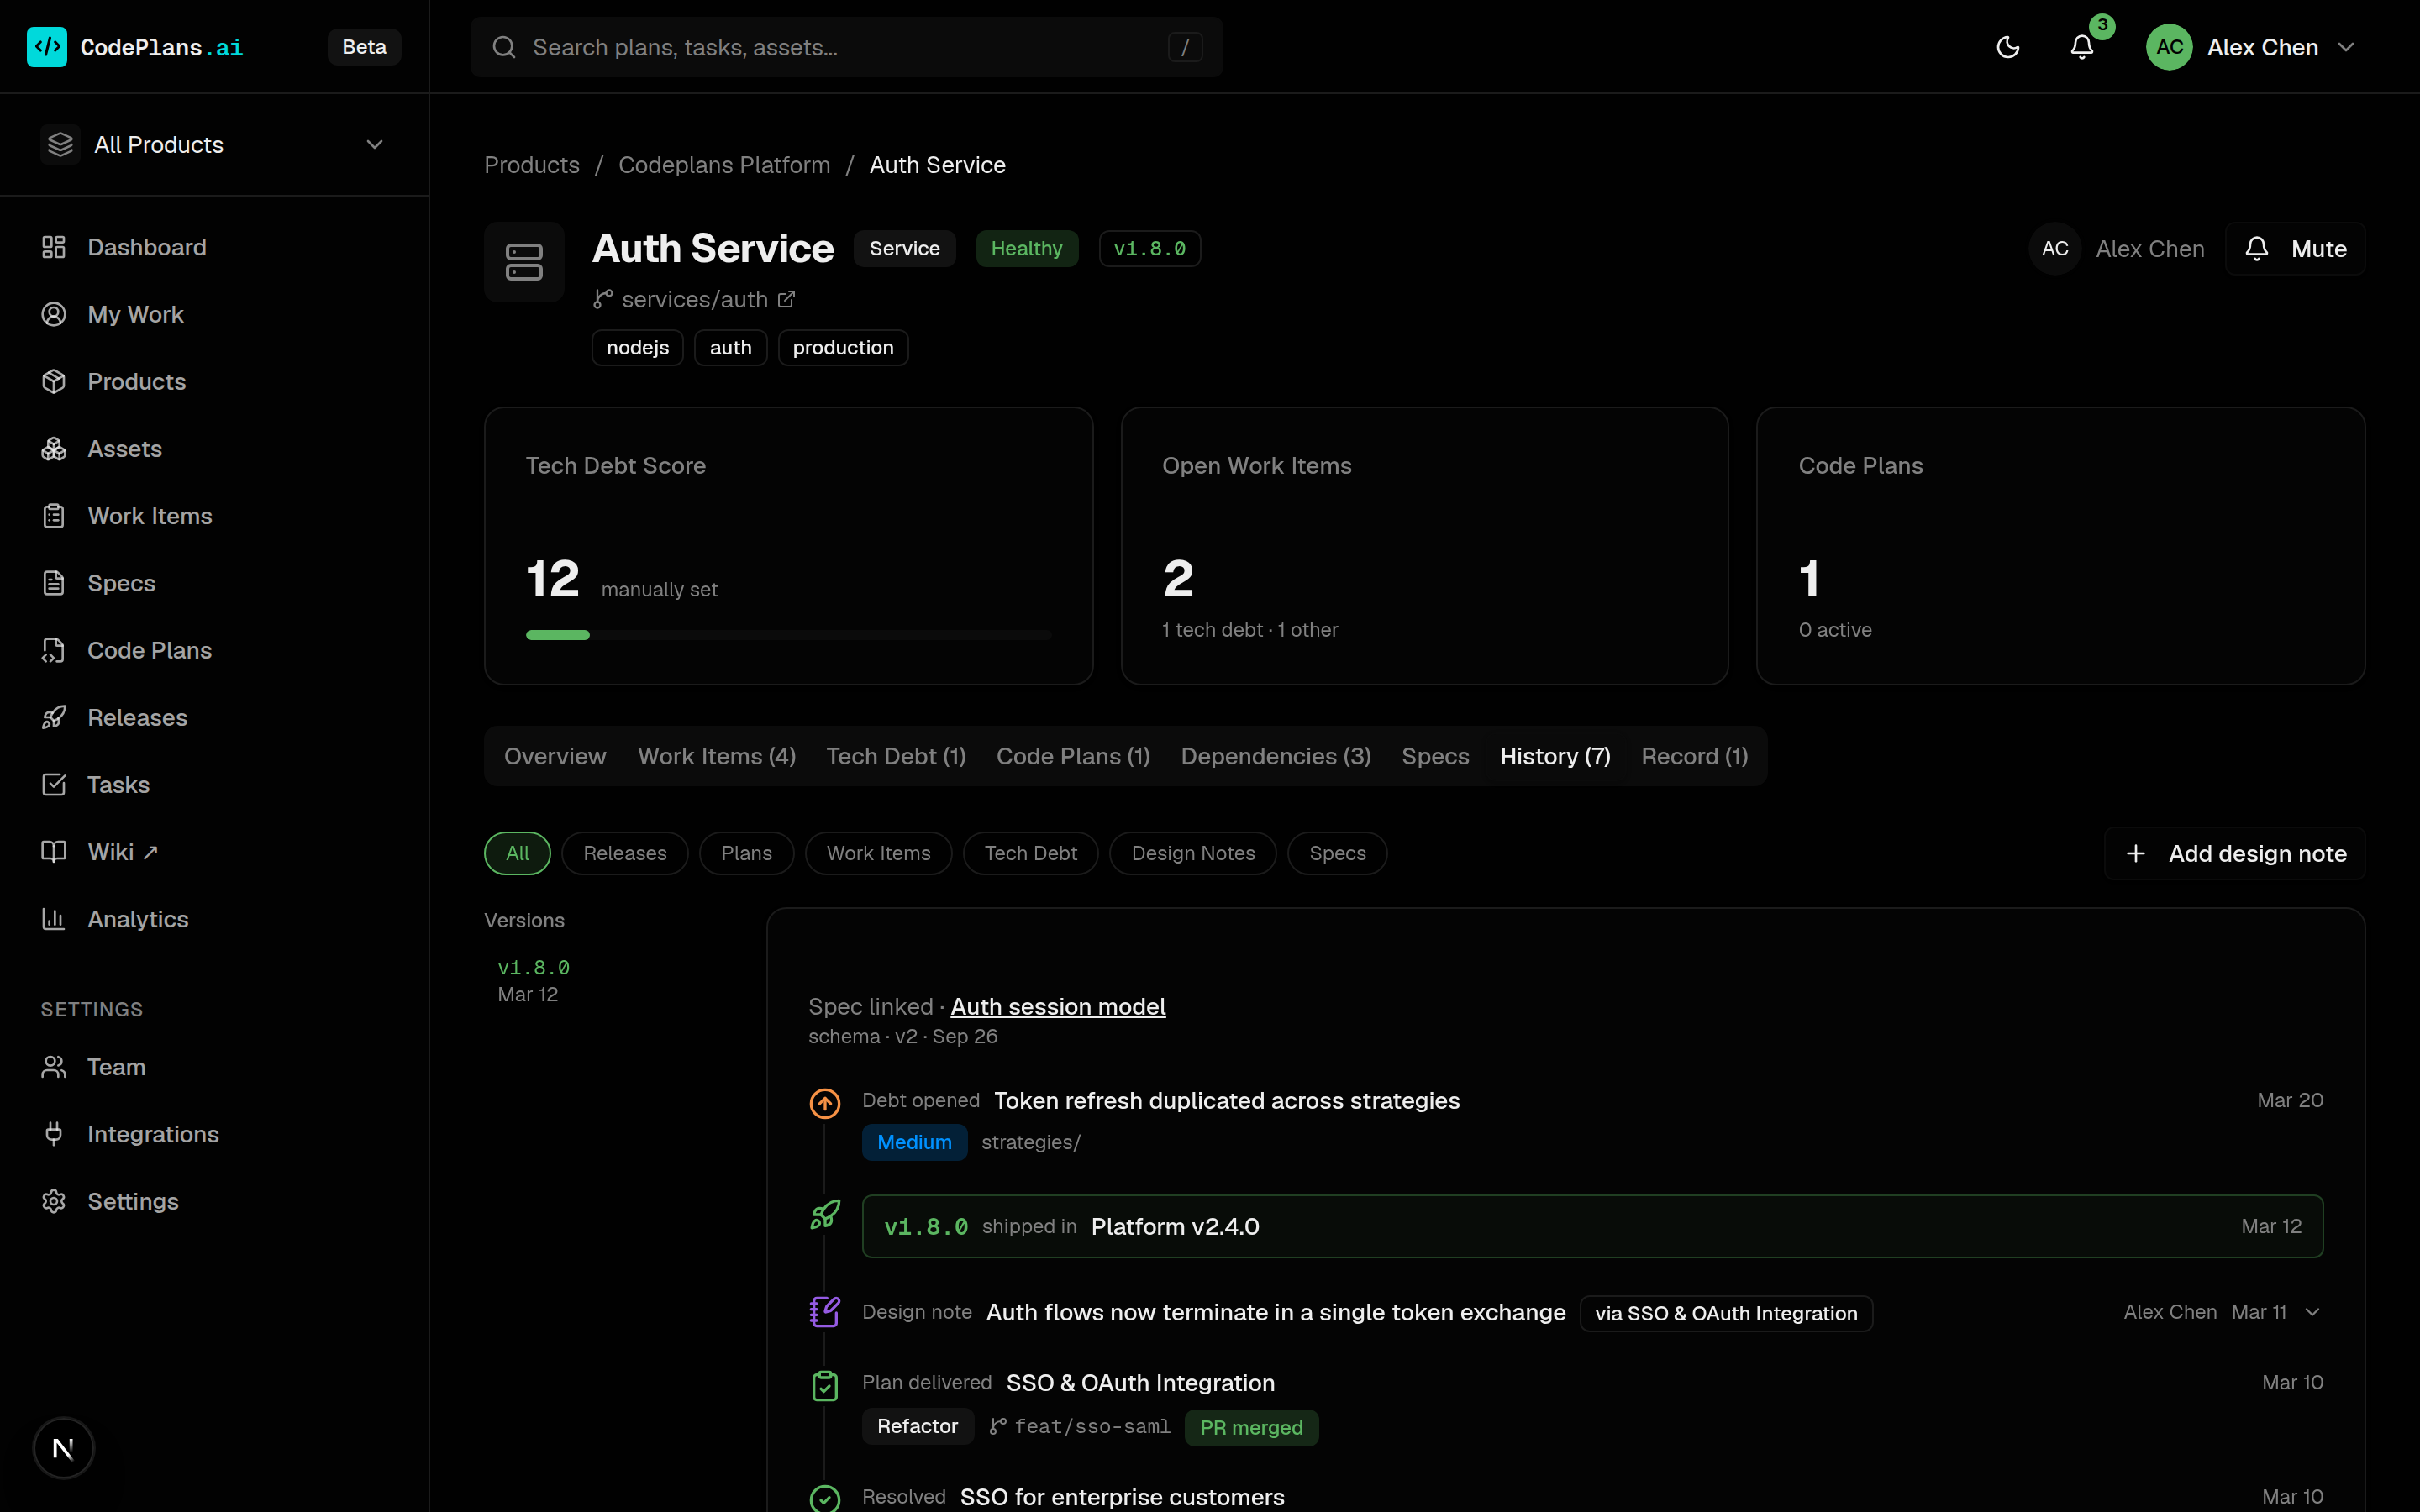
A version ladder for every asset
Releases shipped, plans delivered, debt opened and resolved, and spec revisions, grouped by version. Humans and agents add design notes worth keeping; agent-written notes carry an agent badge.
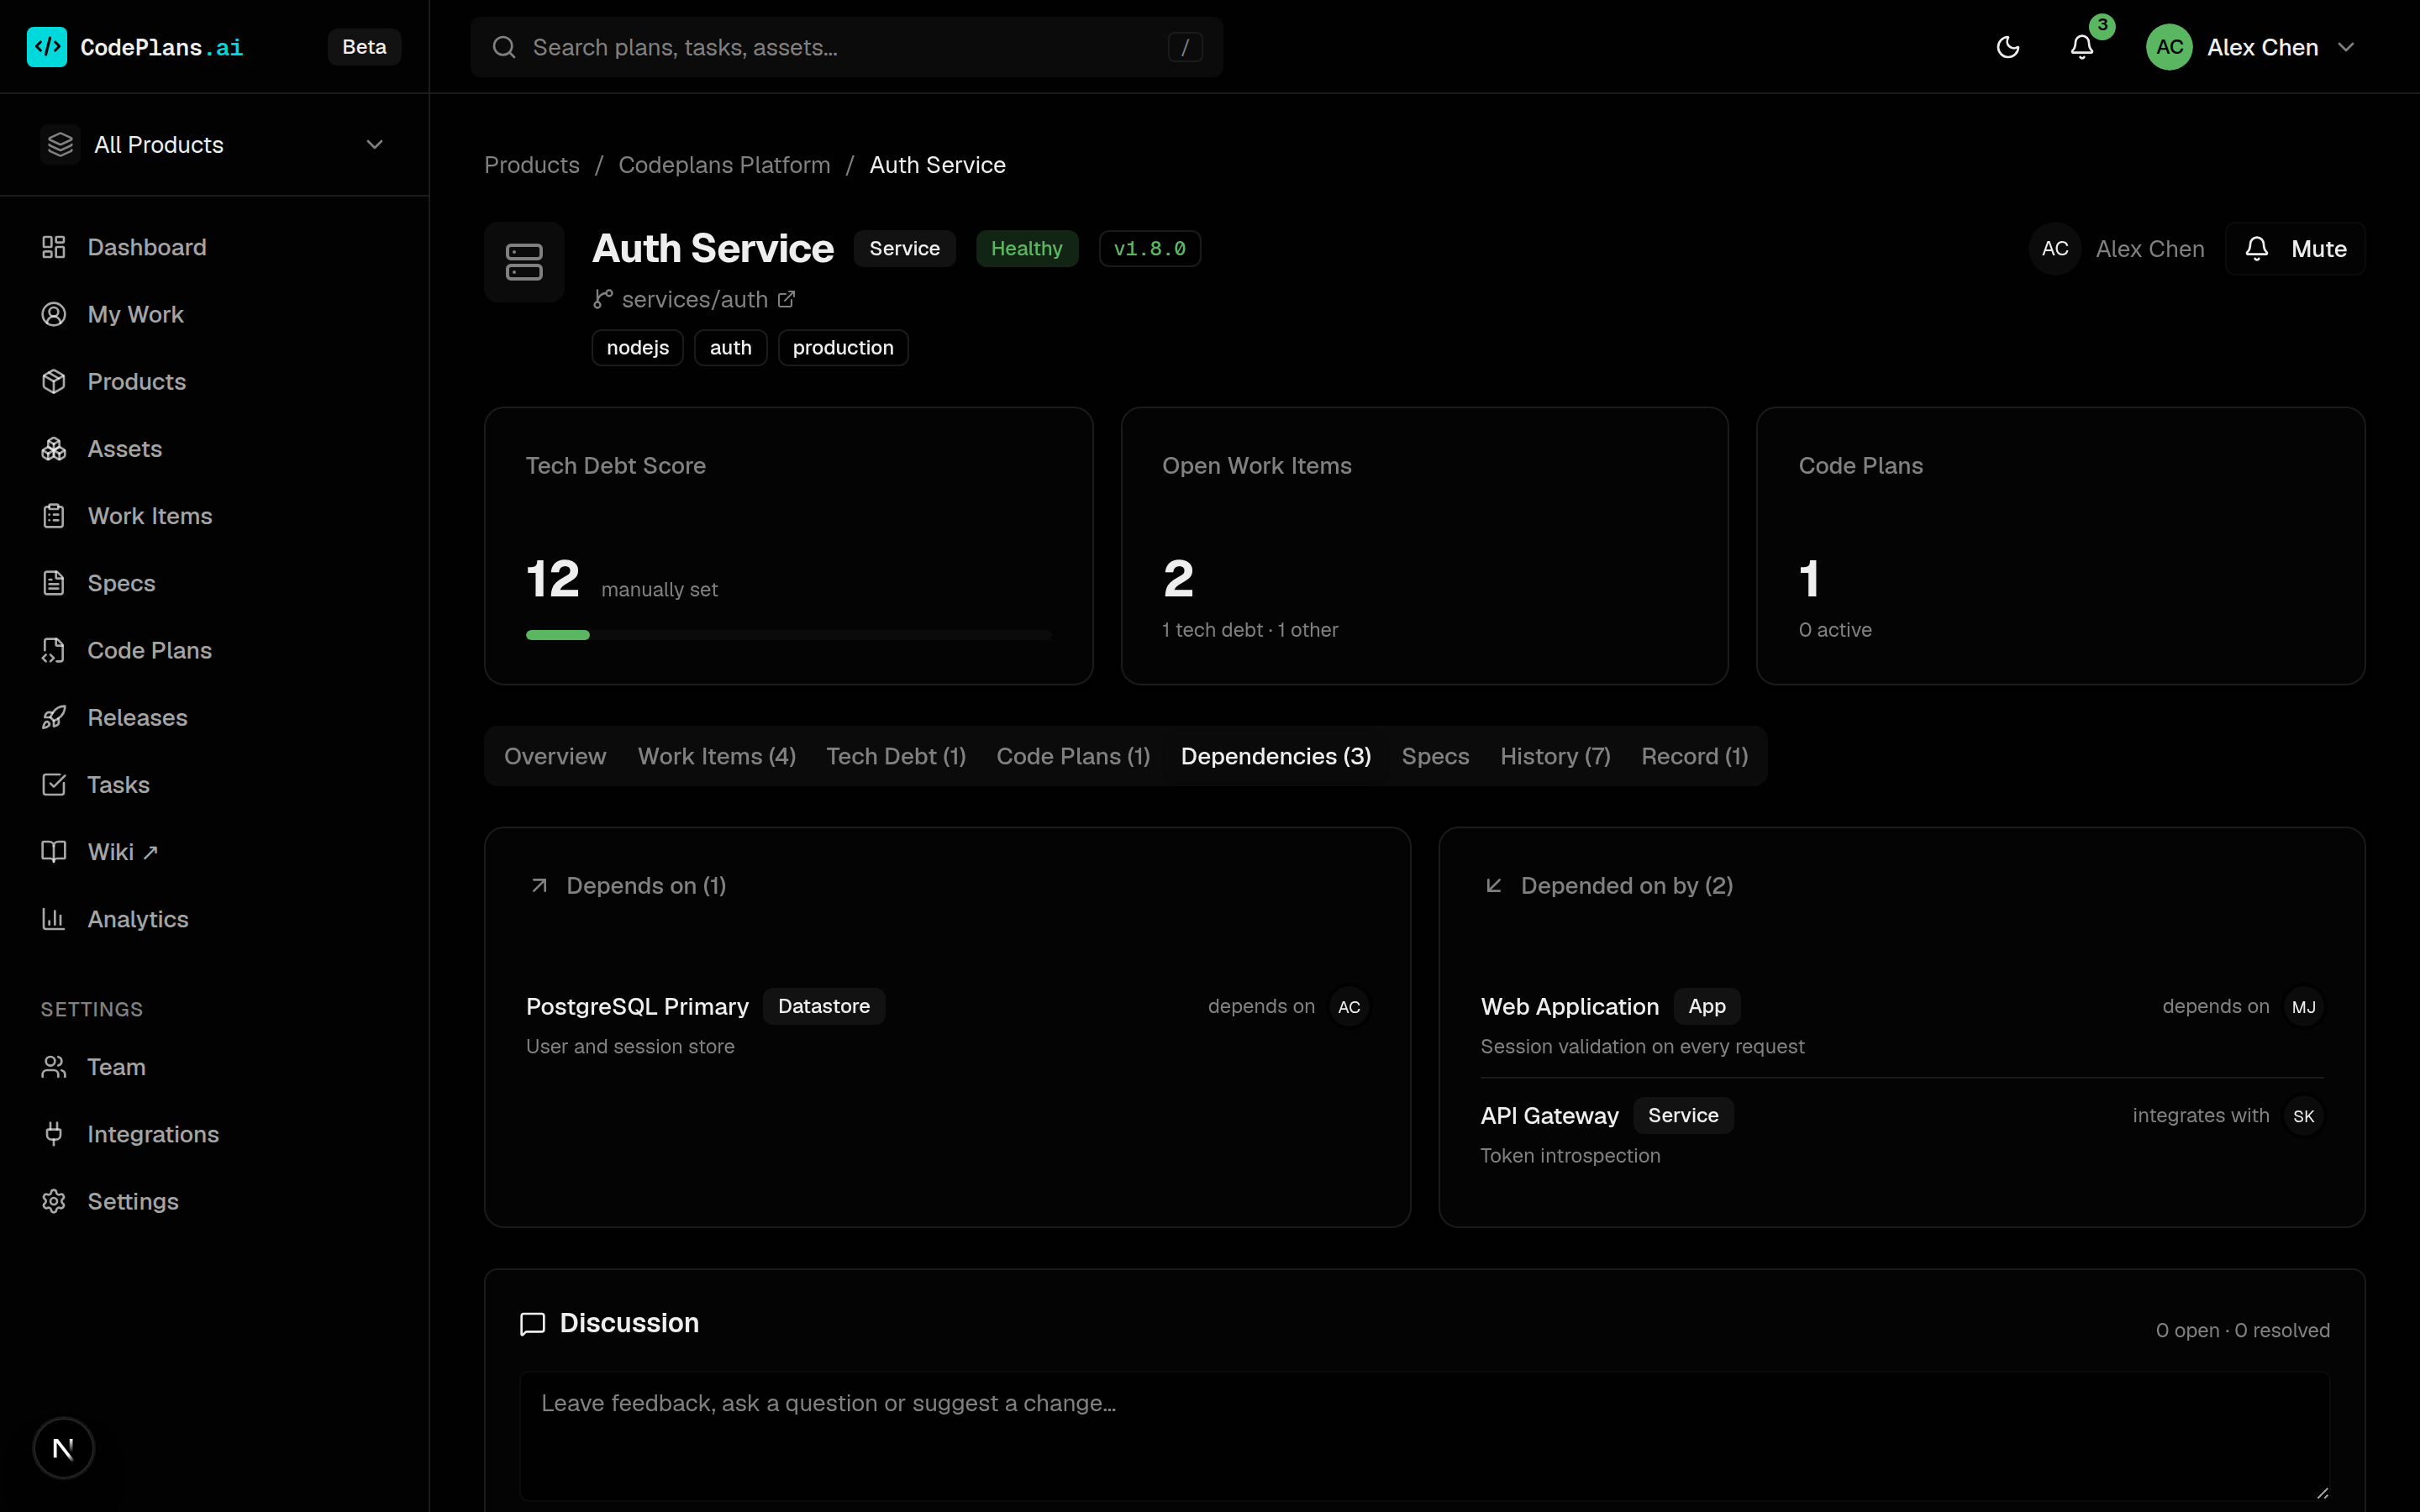
Both directions of the graph
What an asset depends on and what depends on it, feeding impact analysis whenever a plan targets it. Owners, discussion and a personal Mute switch live on the same page.